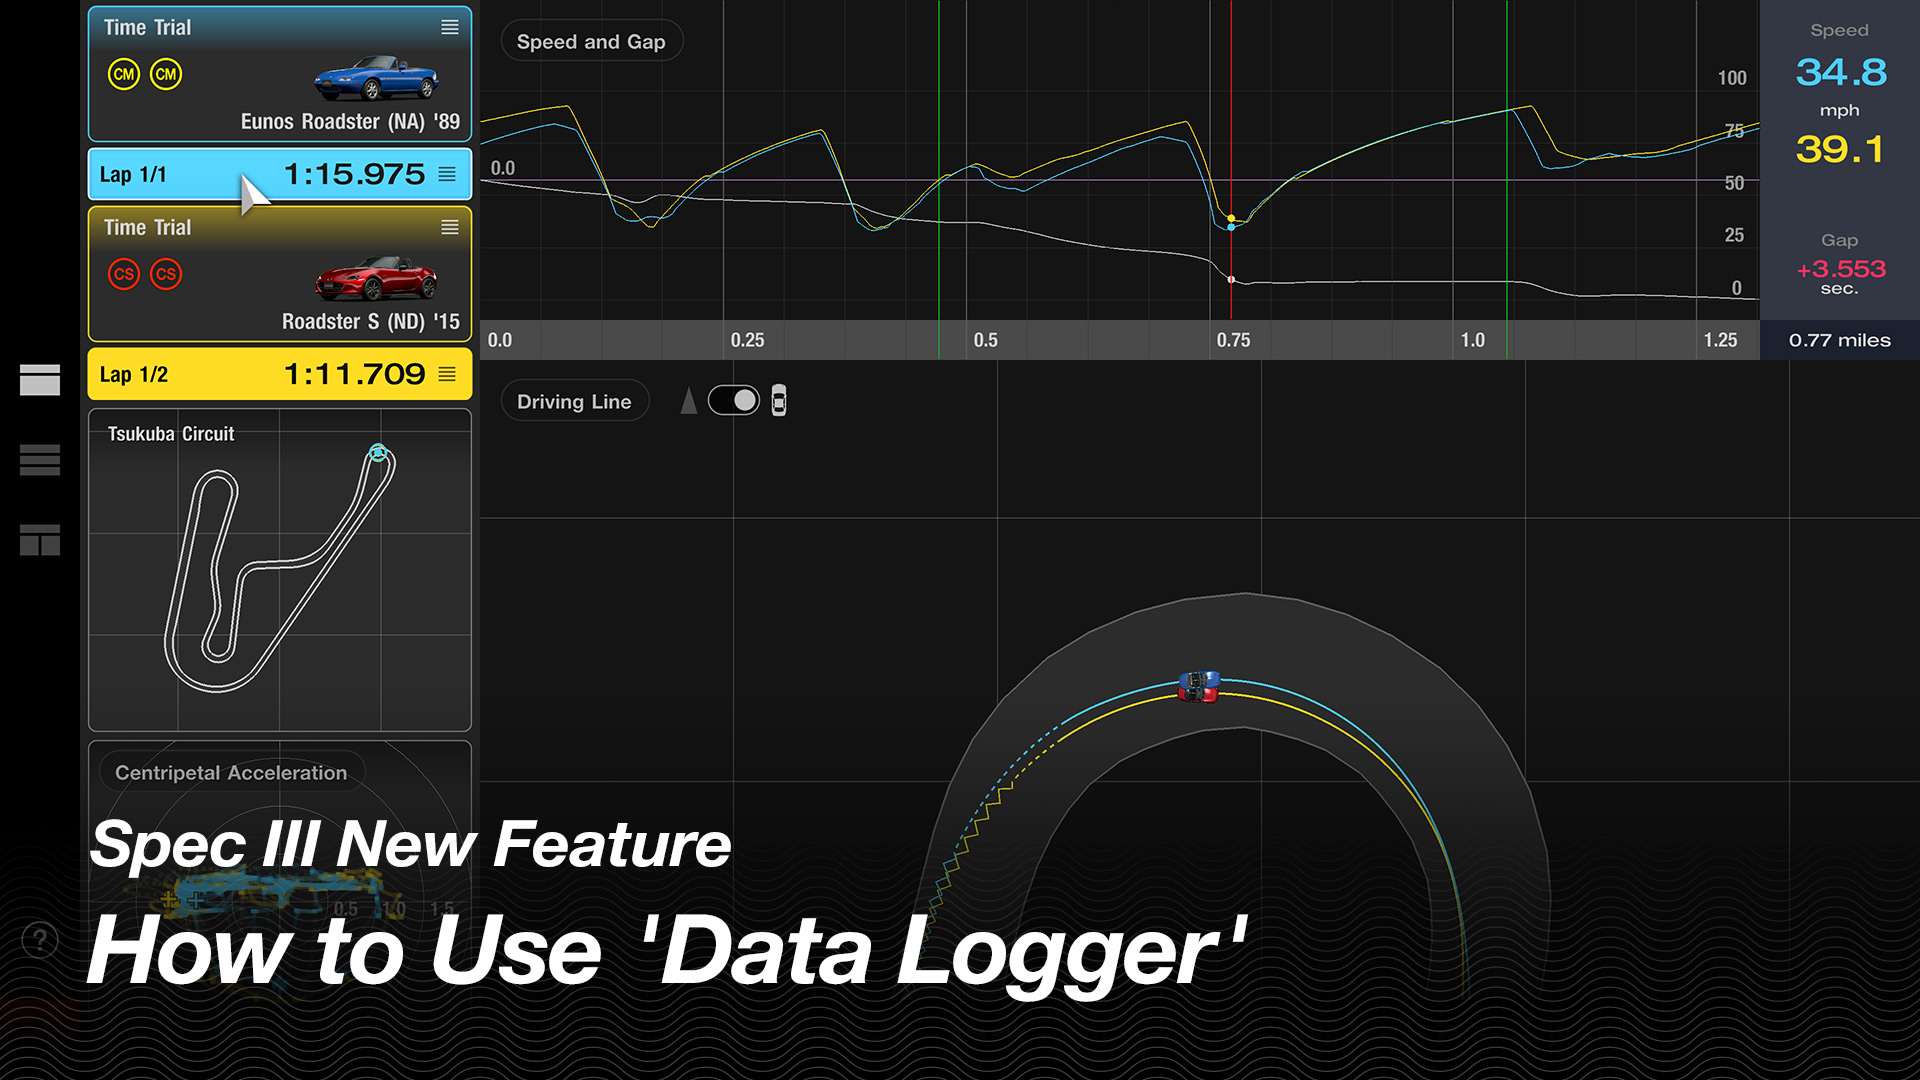
Introducing the New Data Logger Feature!
The Spec III update introduces the new Data Logger feature—a tool that creates a visual representation of your driving data, much like the analysis used in real motorsports. In this guide, we’ll share a few examples to help you get started if this is your first time using it.
Why use the Data Logger? By studying your driving data, you can identify areas for improvement and become a more precise, faster driver. To do this effectively, it’s best to compare two sets of data rather than reviewing a single run on its own. You can load your personal best laps, or download replay data from the fastest players in the online rankings. Compare your data with an example, look for differences, and pinpoint opportunities to improve. That’s the foundation of using the Data Logger.
Let’s take a look at two examples.
■ Compare and Improve Driving Techniques
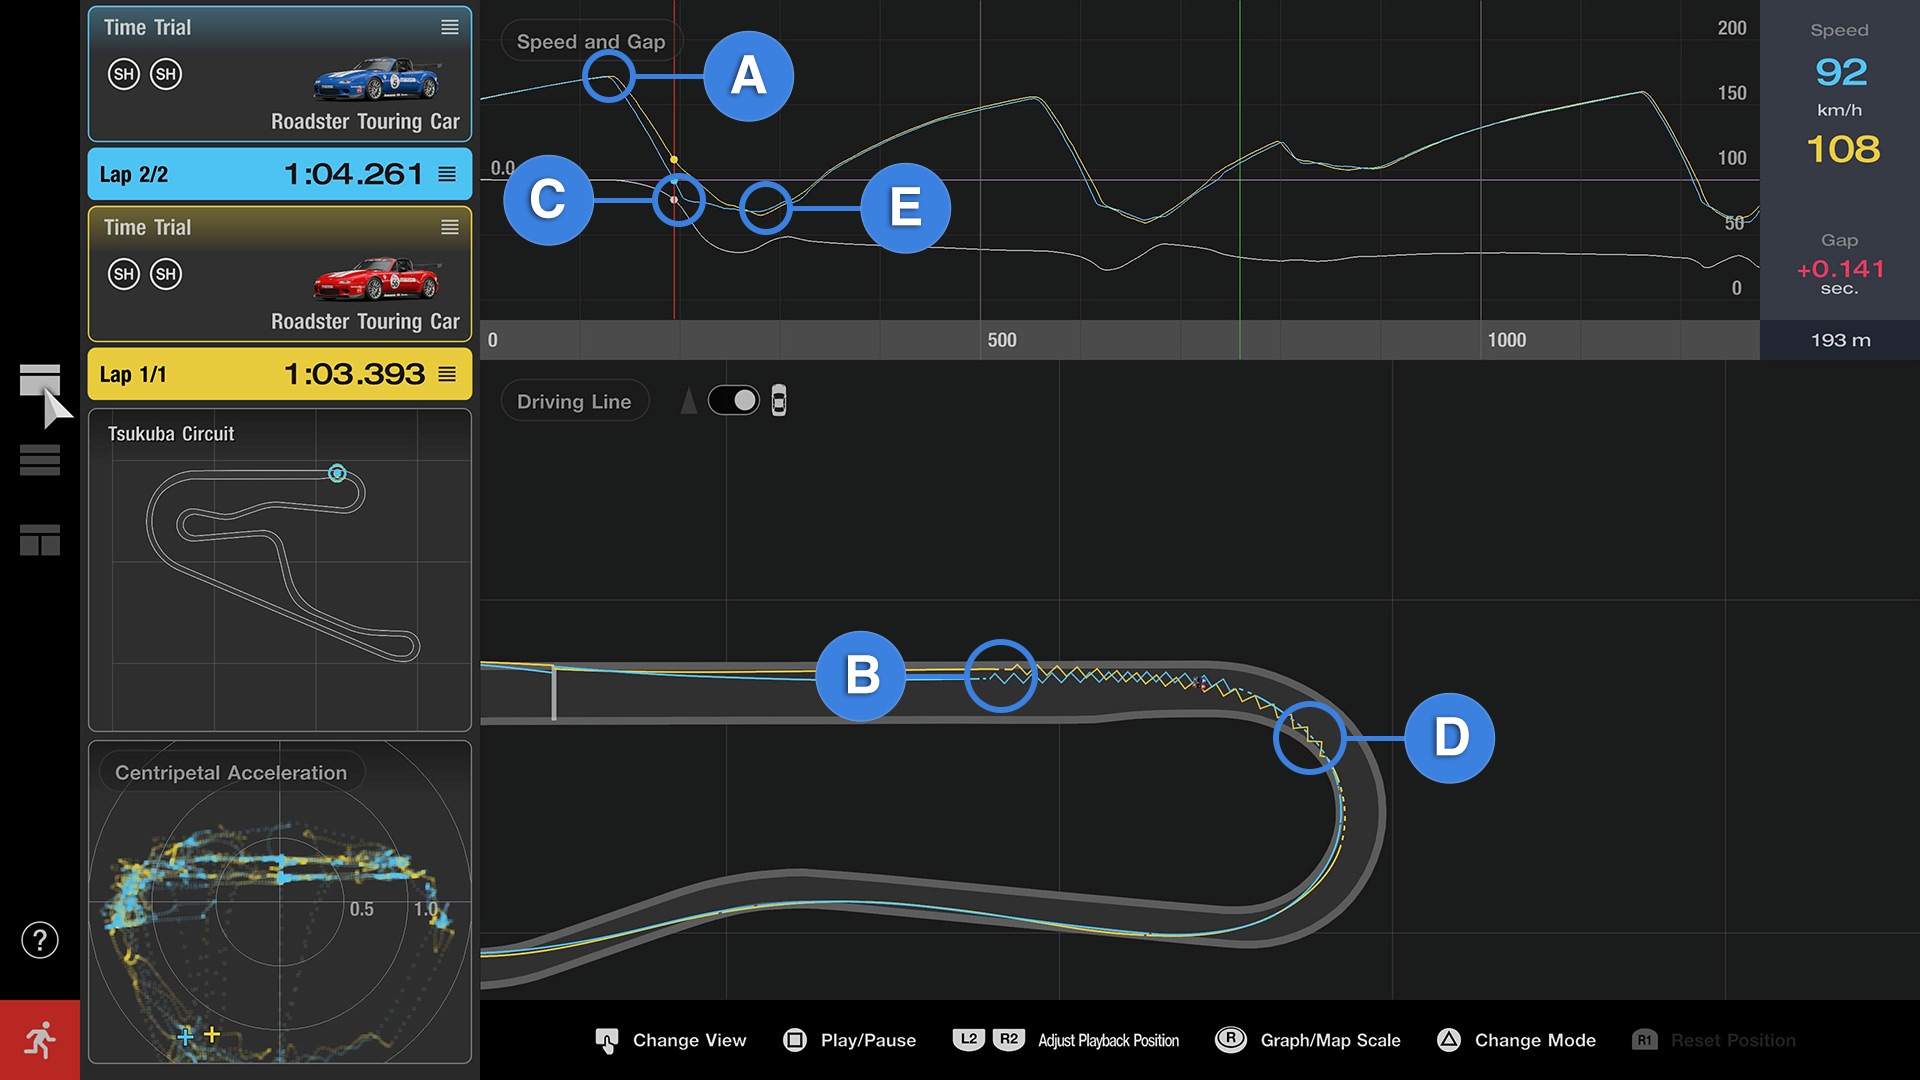
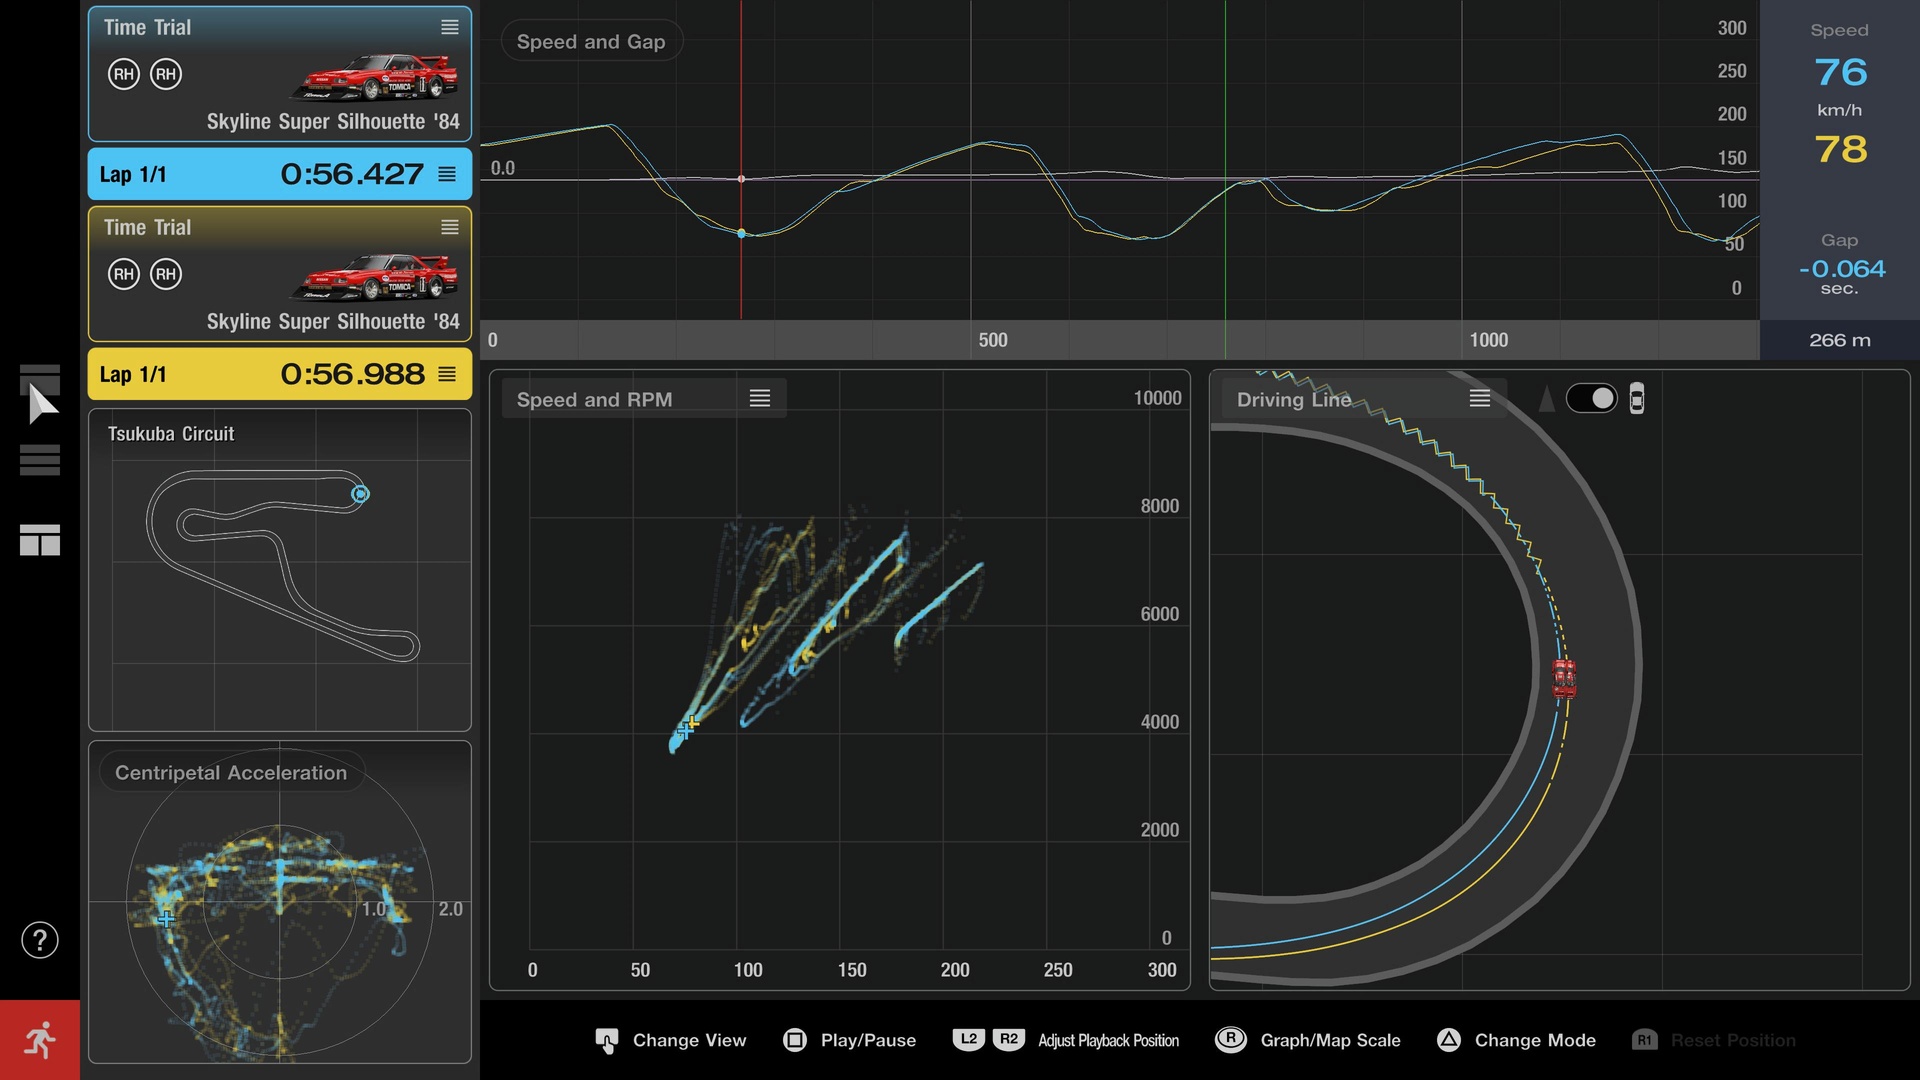
What separates a fast driver from a slow one? In this example, we’ll compare two drivers tackling Turn 1 at Tsukuba Circuit in the same car and look for ways to improve.
Here, we’re examining the blue and yellow data lines. The blue line represents the slower lap. By reviewing the “Speed and Gap” graph alongside each driver’s plotted “Driving Line,” several differences stand out. Although both cars reached the same top speed on the main straight (A), the blue car began braking earlier (B). As a result, its speed dropped too much at corner entry (C), forcing the driver to rely on momentum through the apex before accelerating again at corner exit (D).
The yellow car, on the other hand, maintained steady braking deeper into the corner. This produced a slightly lower minimum speed (E), but also allowed the driver to begin accelerating earlier and carry more speed out of the turn.
It’s only one corner, but the time gap on exit has already widened to half a second. From this data, we can see that the blue-line driver could improve by braking later and reducing the amount of time spent coasting—neither accelerating nor braking.
By comparing driving data in the Data Logger, it becomes clear where and why these differences occur. Study faster drivers and try applying their techniques—an effective shortcut to improving your racing performance.
■ Compare and Improve Car Settings
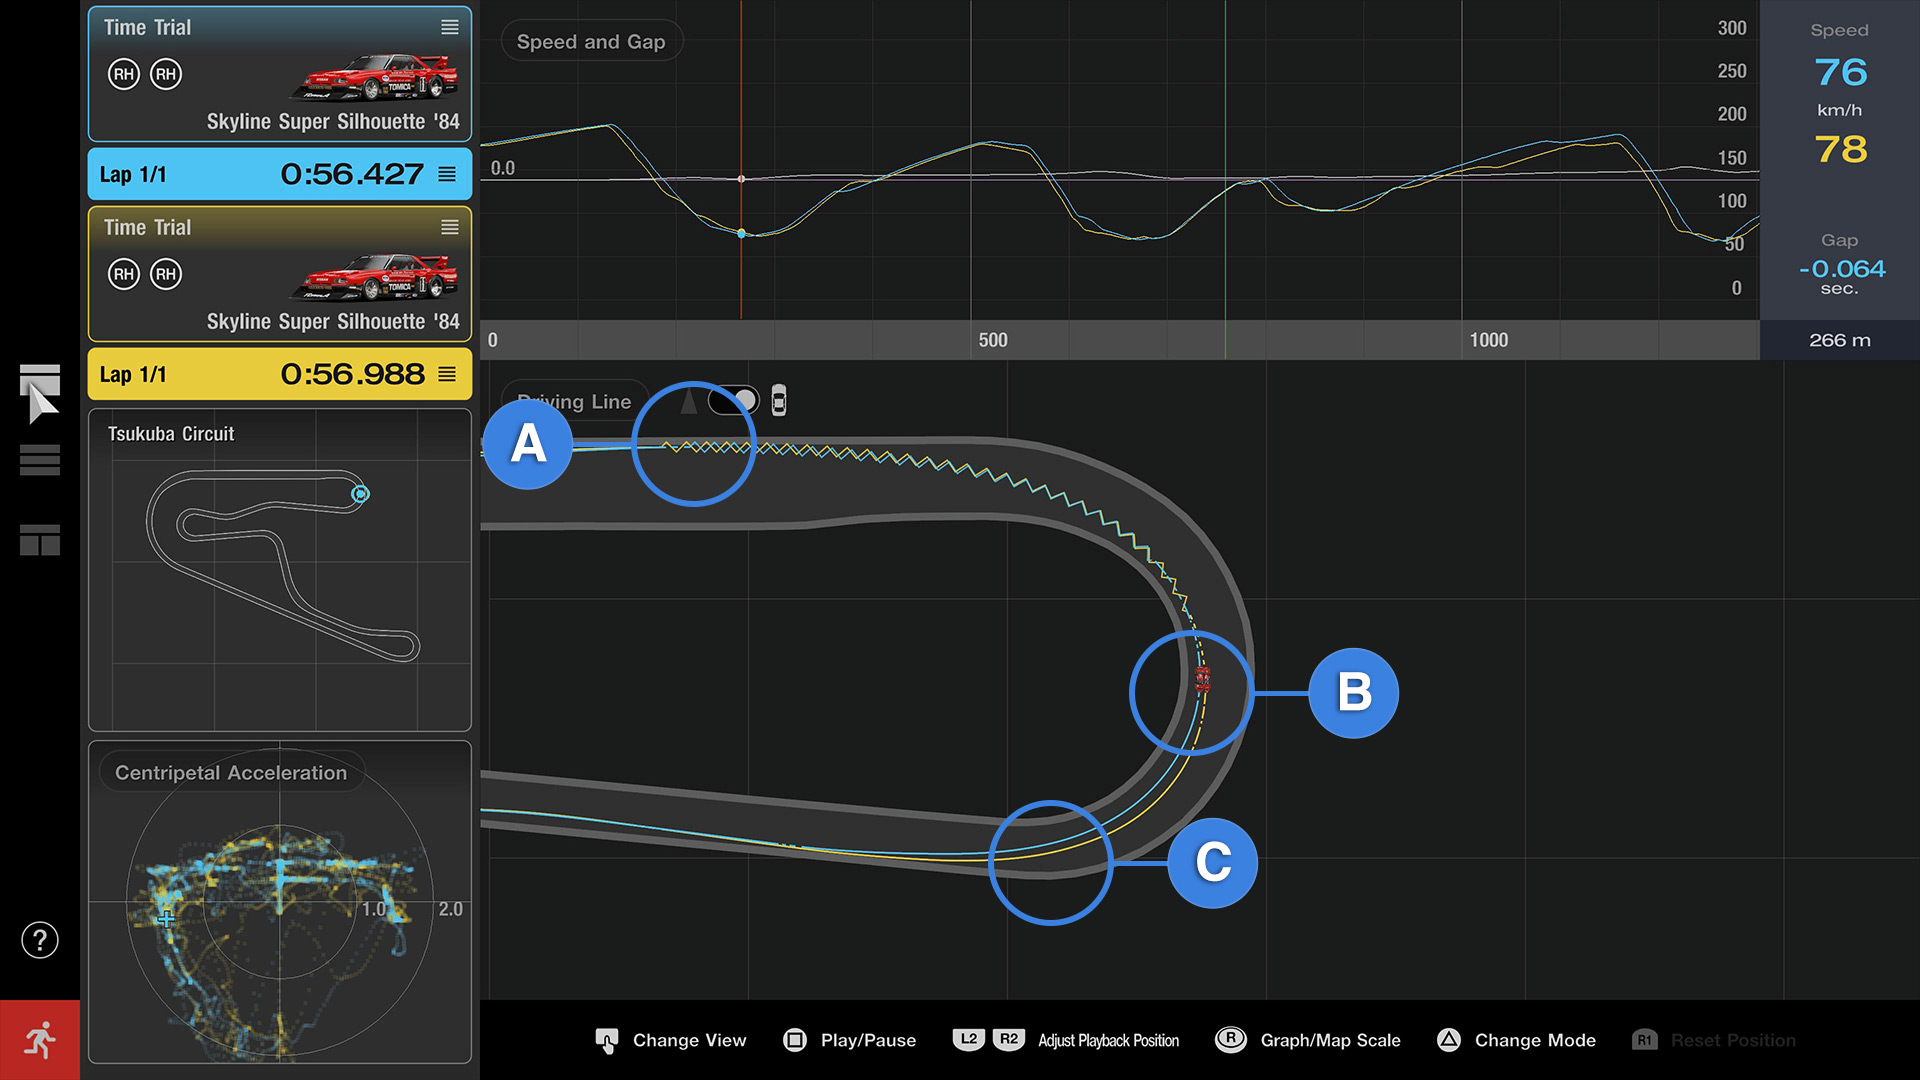
The Data Logger is also an excellent tool for fine-tuning your car settings. Let’s switch cars and examine the same corner; Turn 1 at Tsukuba Circuit.
In this example, the yellow car is running default settings, while the blue car has increased front downforce, giving the front tires more grip. Notice that the blue car brakes later than the yellow car (A) yet turns in cleanly without understeer. The added front downforce improves its cornering response. You can also see that the blue car gets back on the throttle earlier (B). On corner exit, the yellow car fights understeer and drifts wide, while the blue car holds a tighter, more controlled line (C). By the time they exit the corner, the blue car has gained 0.3 seconds.
This data shows that even in a low-speed corner like Tsukuba’s Turn 1, increasing front downforce can have a significant effect. The car used in this test naturally tends to understeer, but on tracks with many tight corners—like Tsukuba—additional front downforce helps improve rotation and reduce lap times.
With the Data Logger, tuning is no longer guesswork. The information is right there, allowing you to see what works and what still needs adjustment. In this example, we added front downforce, but could you achieve a similar result by reducing rear downforce instead? Try it for yourself and let the Data Logger guide you toward the best setup.
These are just two examples of how you can use the Data Logger, but the tool offers far more. You can compare different cars on the same track or analyze how various tire types affect performance.
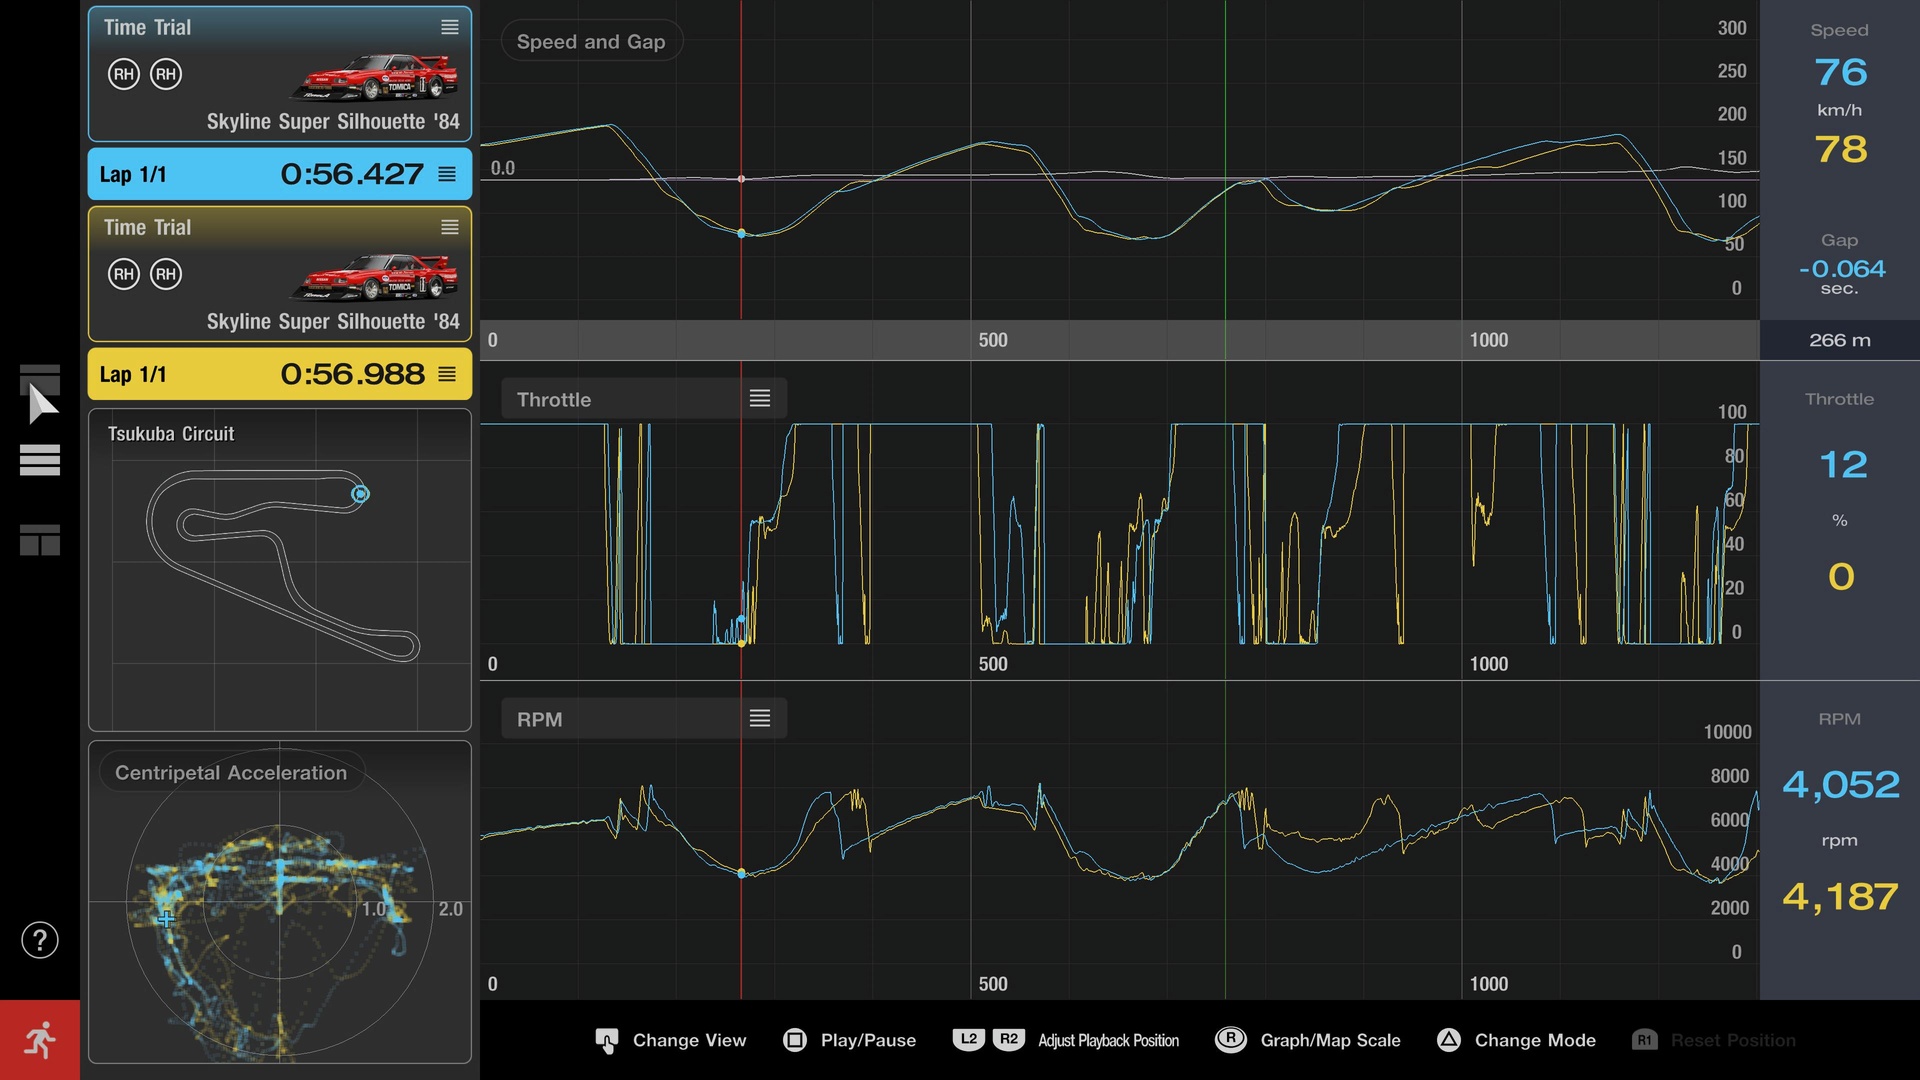
The examples above use “View 1,” but there are several other ways to look at your data. “View 2” displays inputs such as throttle and brake alongside lateral Gs and other metrics, while “View 3” highlights information like speed and engine RPM. There’s a wealth of data to explore and interpret, so take some time to dive in and see what insights you can uncover.
View 2
View 3