Races
Using the Data Logger
By allowing you to compare two best lap replays, the Data Logger tool helps you discover all sorts of interesting things about your driving performance. This page explains the basic features of the Preset screen, using the example of two cars driving on the Tsukuba circuit.
1. Study the Time Difference
Once both best lap replays have been loaded and are displayed on-screen, take a look at the "Time Difference" graph, in the Preset graph area. While looking at this graph, refer to the current position indicated on the Track Map to the right. This will give you an idea of how the difference in the two cars' times is reflected on the track.
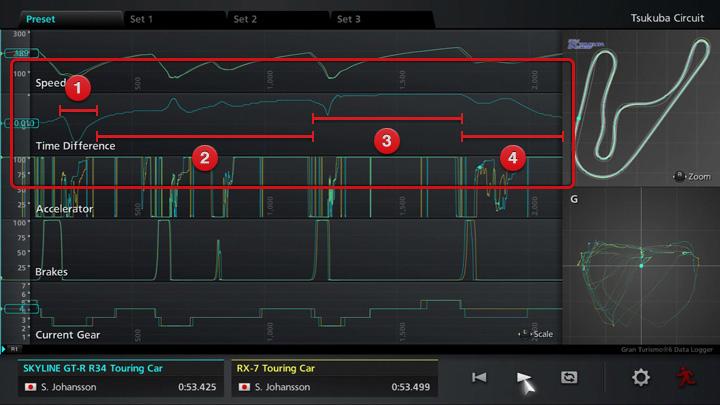
When the line on the Time Difference graph is above the "0" mark at the centre of the graph, it means that the car in the current slot (in this case a GT-R R34 Touring Car, hereafter referred to as the GT-R) is in the lead. If the line is below the "0" mark, it means the car in the reference slot (in this case an RX-7 Touring Car, hereafter referred to as the RX-7) is in the lead.
- This time difference graph shows the following:
- The GT-R is behind the RX-7 at the first corner.
- Immediately afterwards, the GT-R overtakes, and the time difference gradually increases.
- The gap closes at the second hairpin, but opens up again on the back straight.
- The RX-7 slowly gains on the GT-R at the last corner.
2. Change the Graph Scale
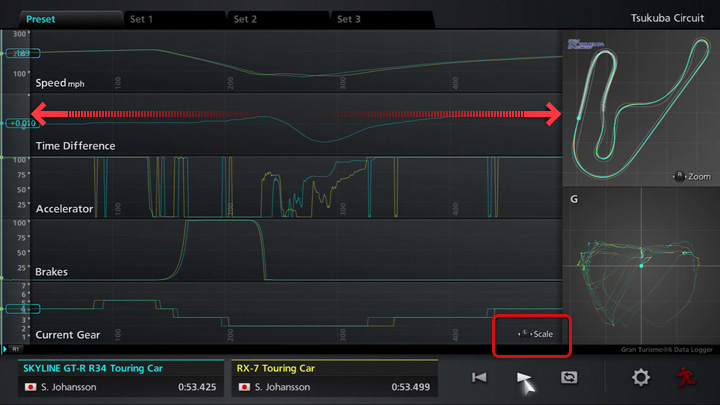
If you want to analyse specific sections of a track, push the left stick to the right to increase the graph's scale. Choose the specific moment you wish to examine by moving the play head using the R1 and L1 buttons. In the screenshot above, the graph's scale has been enlarged to focus on the first hairpin, where the GT-R built up a 0.284 second lead on the RX-7.
3. Refer to Other Data
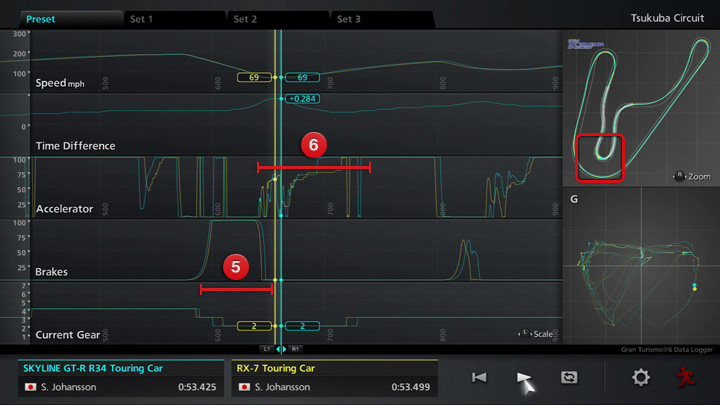
Sticking to the first hairpin, let's look at some data other than the time difference. Differences between the two cars can be observed on the "Acceleration" and "Braking" graphs, too.
- The RX-7 (yellow line) stops braking more quickly than the GT-R (blue line).
- When pulling out of the corner, the RX-7 holds off on the accelerator, while the GT-R floors the accelerator more quickly.
4. Understand Trends
Following steps 1-3 allows us to observe the following trends in the way the two cars were driven:
- ・The RX-7 is faster when cornering.
- ・The GT-R is faster on straights.
- ・The RX-7 is the lighter car, and therefore has the edge when braking.
- ・The GT-R is better at coming out of corners, as it makes the most of the stability provided by its 4WD drivetrain.
Using the Data Logger tool like this allows you to compare and understand the key characteristics of two cars, and of two drivers. When you become more familiar with the tool, you can use the Set 1, Set 2 and Set 3 tabs to display various data, and analyse replays from a number of different perspectives.

- © 2016 Sony Interactive Entertainment Inc. Developed by Polyphony Digital Inc.
Manufacturers, cars, names, brands and associated imagery featured in this game in some cases include trademarks and/or copyrighted materials of their respective owners. All rights reserved. Any depiction or recreation of real world locations, entities, businesses, or organizations is not intended to be or imply any sponsorship or endorsement of this game by such party or parties. "Gran Turismo" logos are registered trademarks or trademarks of Sony Interactive Entertainment Inc.
