Races
Data Logger
The Data Logger is a useful tool that allows you to analyze your driving performance by creating graphs based on data taken from saved best lap replays, such as speed, RPM, and gears used.
From the "My Home" screen, select "Tools" followed by "Data Logger", and you will be prompted to load a best lap replay. Select "OK" and a list of best lap replays will be displayed. Select the best lap replay you wish to load into the Data Logger. Please note that replays must not exceed 20 minutes in length, and only best lap replays recorded in the following modes can be loaded:
- ・Free Run
- ・Single player Time Trials in Arcade Mode.
- ・Seasonal Events
Launching from the Quick Menu
If you have driven one or more valid laps in one of the above modes, the Data Logger icon will be displayed on the post-race Quick Menu. Select this icon to launch the Data Logger. Please note that Data Logger functionality is limited in the following ways when it is launched from the Quick Menu:
- ・Only the best lap replay from the race that has just been completed can be loaded in the current slot.
- ・Only Preset tabs can be used. As a result, settings for Set 1/Set 2/Set 3 cannot be adjusted from the "Options" at the bottom-right of the Data Logger screen.
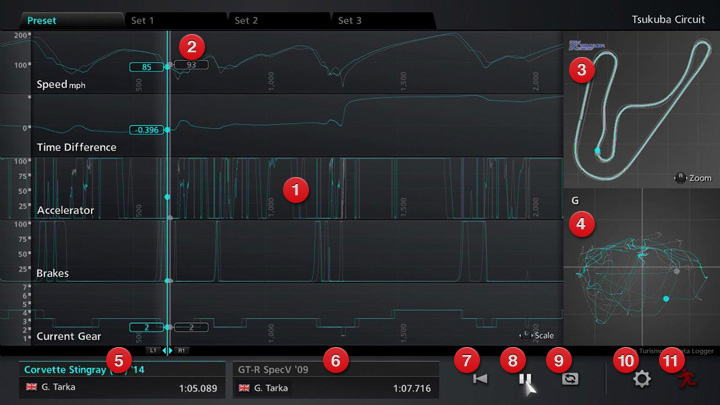
The Main Screen
Once the logger data has been successfully extracted, the Main Screen is displayed. On the Main Screen, the replay is represented in graph form. The Main Screen contains the following components:
- Graph Area
- Playback Head (*Moves as the replay progresses.)
- Track Map
- G Meter
- Current Slot (Current Data)
- Reference Slot (Reference Data)
- Replay from Start
- Play/Pause
- Repeat/Play Once
- Options
- Exit
The Graph Area
In the Graph Area, five different types of driving data are loaded from the replay and displayed in chart form. At the top of the Graph Area are the following tabs: [Preset], [Set 1], [Set 2], and [Set 3]. You can choose the driving data that is displayed on these tabs. While the five types of data displayed on the [Preset] tab cannot be changed, the data displayed on the [Set 1], [Set 2], and [Set 3] tabs can be selected from 9 different options (10).
Play Logger Data
Selecting "Play/Pause" (8) allows you to play or pause the logger data that has been loaded from the replay. While logger data is playing, the vertical line known as the playback head will move across the Graph Area, allowing you to observe the changes in the driving data. The position of the car is displayed on the track map (3), while the G Meter (4) displays the changing levels of gravitational acceleration ("Gs") that are produced. You can rewind or fast forward the logger data using the R1 and L1 buttons. The R2 and L2 buttons allow you to jump between sectors of the logger data. Moving the left stick left and right allows you to adjust the scale of the graphs.
What is the G Meter?
The G Meter displays the levels of gravitational acceleration that are produced while driving. The further the tracers are from the center of the G Meter, the greater the level of gravitational acceleration that is produced. From a driving skills perspective, this is an useful indicator of how effectively you are using your tires' grip. The area above the thick horizontal line across the middle of the meter indicates Gs produced by acceleration while the area beneath this line indicates Gs produced by deceleration (braking). The area to the right of the thick vertical line indicates Gs produced by left turns, while the area to the left of the line indicates Gs produced on right turns.
Comparing Data
The Data Logger allows you to load two best lap replays at the same time in order to compare them.
The best lap data that is loaded when you launch the Data Logger is stored in the Current Slot (5). If you wish to compare it to another best lap replay, select the Reference Slot (6), and load the best lap replay you wish to compare.
Once the second best lap replay has been loaded, two sets of data will be displayed in the Graph Area, on the track map, and on the G Meter. You can change which color is used for which data on the graphs, G Meter and so on, by selecting "Options" (10), followed by "Display Settings", and setting the "Current Slot Color" and "Reference Slot Color" as you see fit.
Note that if you have already started playing logger data, the last time difference displayed on the time difference graph may not be consistent with the time difference displayed in the Current and Reference Slots.
Options
The following settings can be adjusted:
- Sound Settings
- ・Engine Sound Playback: Set the engine sounds that will be played while using the data logger. Tick the sounds you would like to be played.
- Display Settings
- ・Display Reference: Set the method for displaying the Reference data. Select "Actual Position" and the Reference data will be displayed driving its actual lap time. Select "Match to Current" and the Reference data will be synchronized with the Current data's position, and its actual lap time will be ignored. (If using this option, refer to the time difference graph to grasp the difference between the times of the two replays.)
- ・Current/Reference Slot Color: Select the color used for both sets of data on the graphs, the track map, the G Meter, and elsewhere.
- Set 1/Set 2/Set 3
- Choose the data that is displayed on each tab. Up to five different types of data can be displayed on each one.

- © 2016 Sony Interactive Entertainment Inc. Developed by Polyphony Digital Inc.
Manufacturers, cars, names, brands and associated imagery featured in this game in some cases include trademarks and/or copyrighted materials of their respective owners. All rights reserved. Any depiction or recreation of real world locations, entities, businesses, or organizations is not intended to be or imply any sponsorship or endorsement of this game by such party or parties. "Gran Turismo" logos are registered trademarks or trademarks of Sony Interactive Entertainment Inc.
